This website use cookies to ensure you get the best experience on our website
Traqplan Waterfall Tutorial
(a Custom PowerBI Visual)
1 The Interface
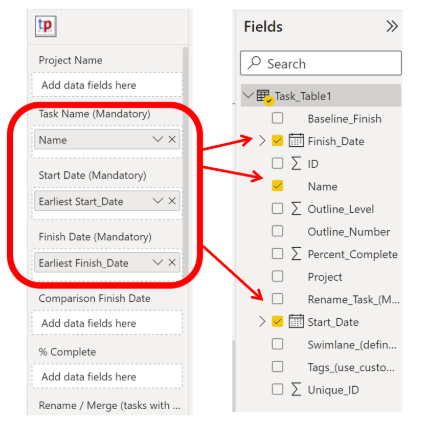
2 First steps to create a visual
Populate the fields shown below with valid data
3 Movement Lines
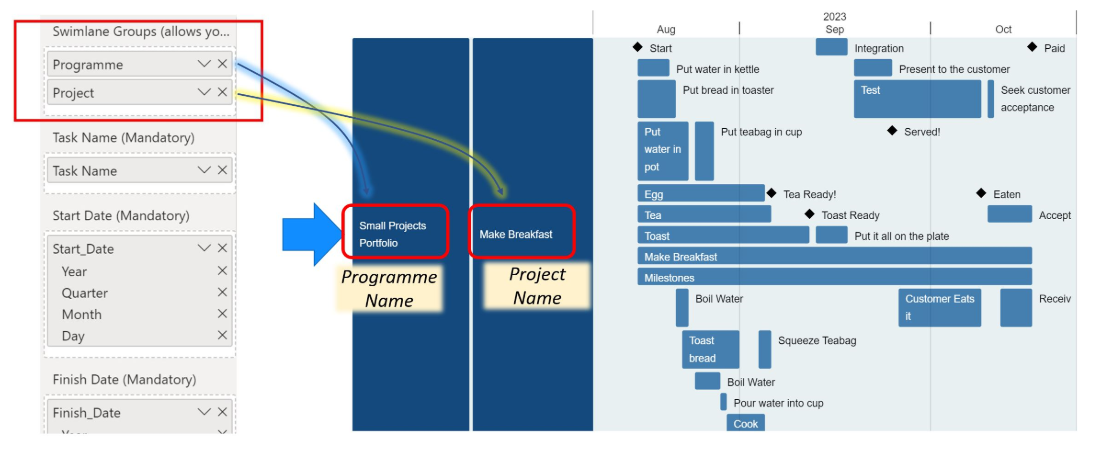
4 Creating Subgroups
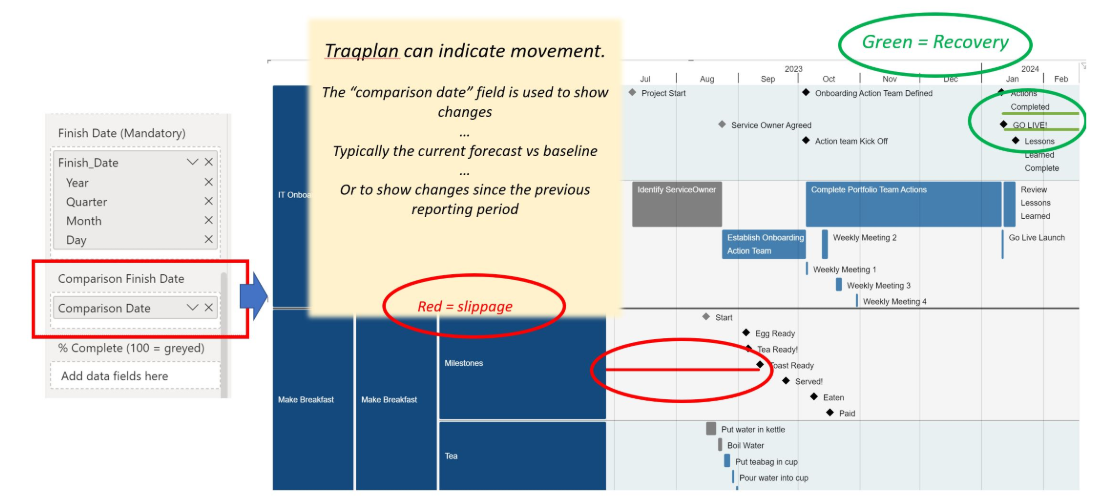
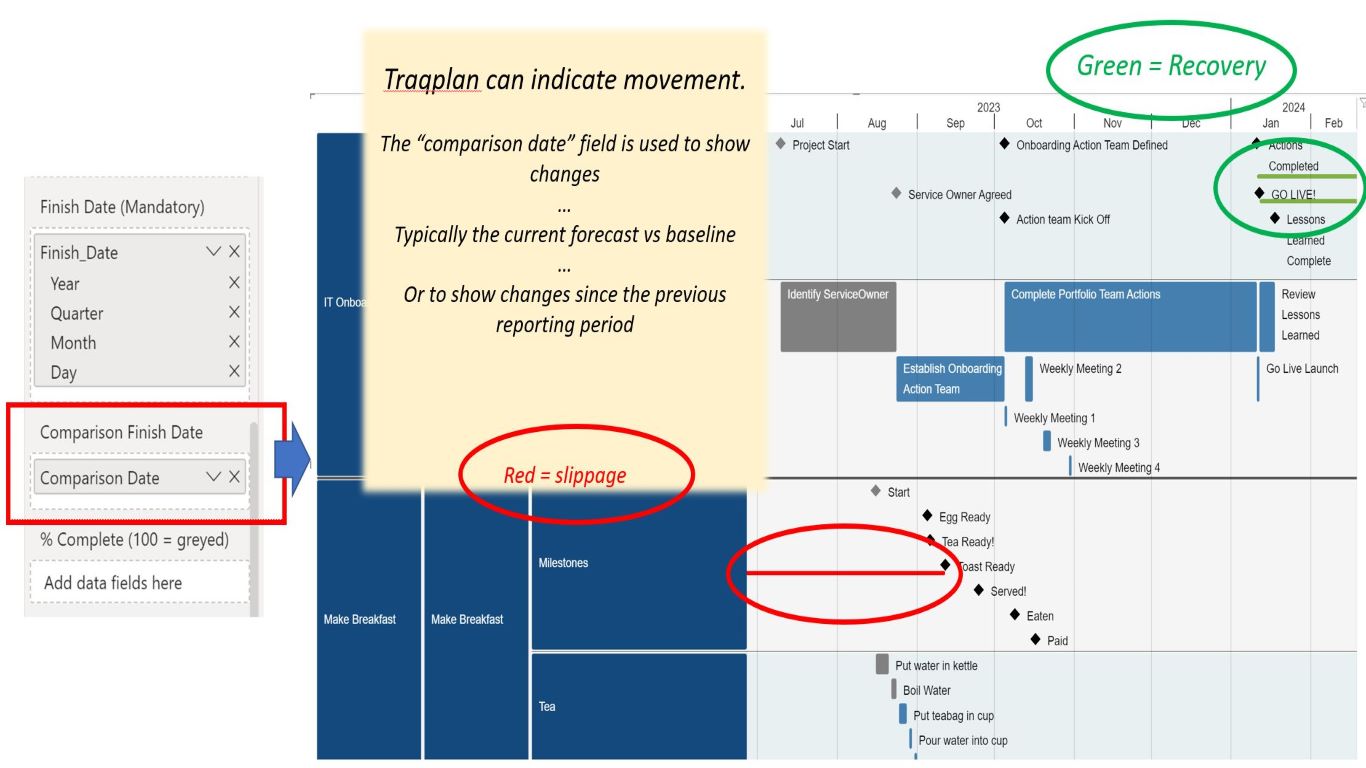
5 Showing changes against a comparison date (eg. a baseline)
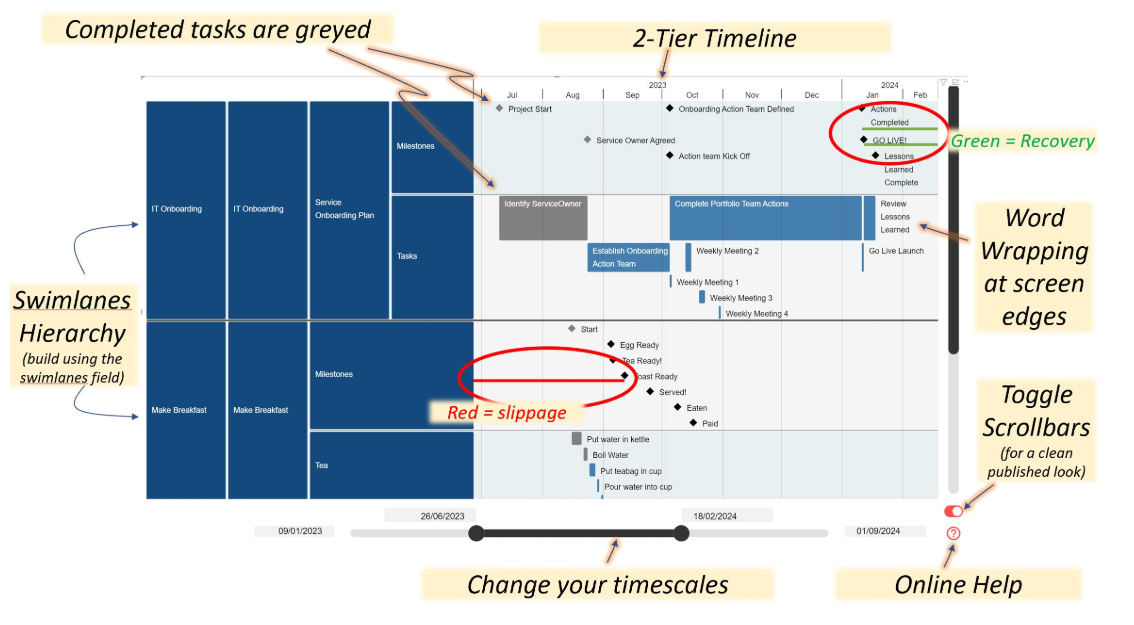
6 Set Swimlane Group Headers

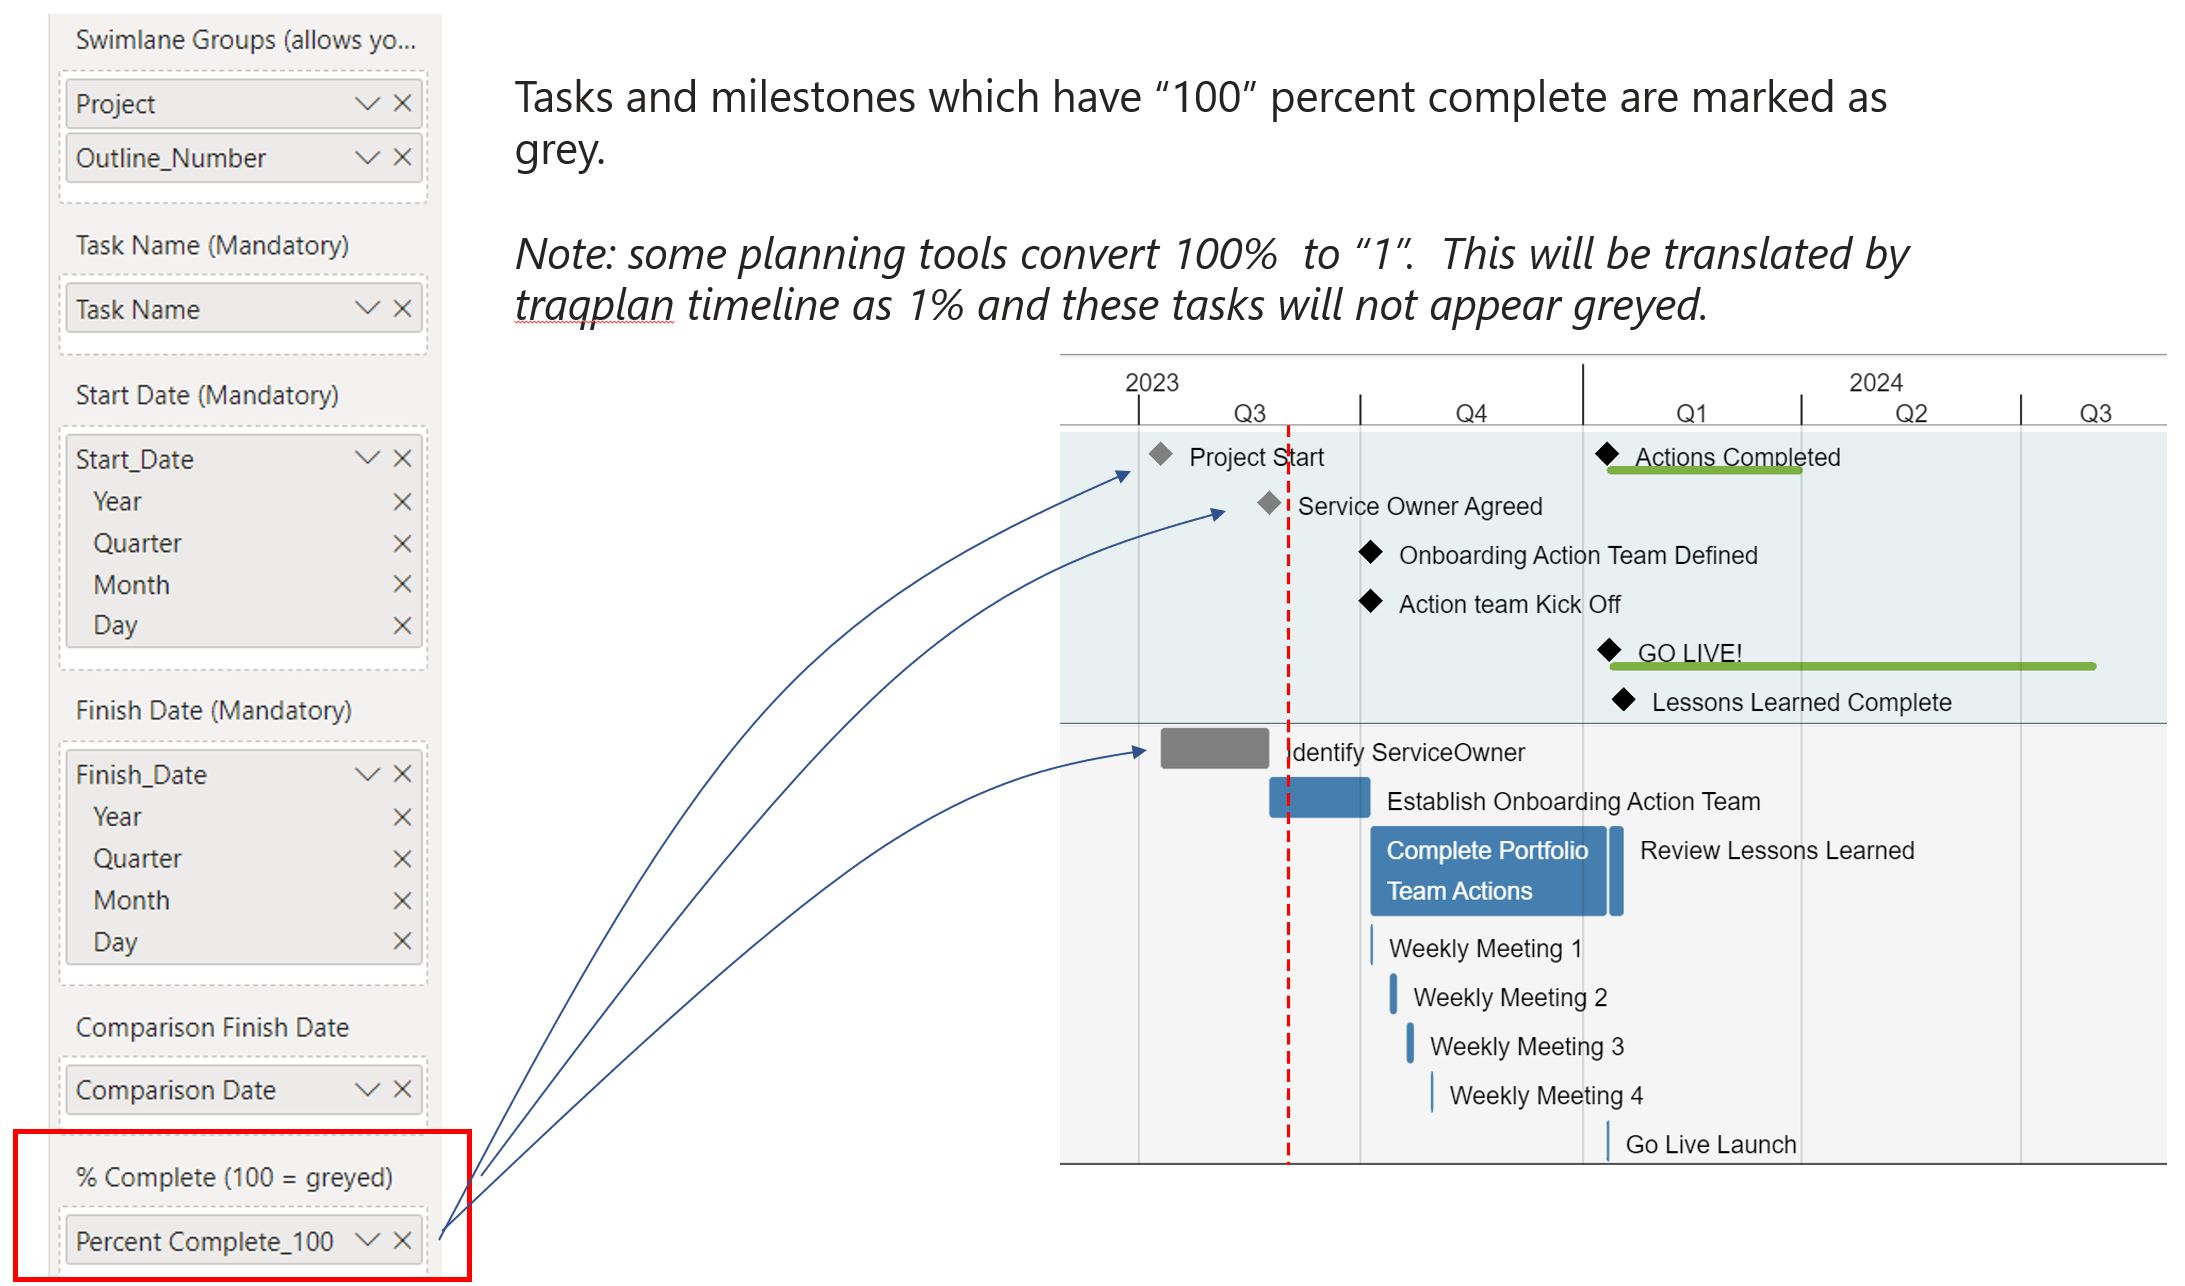
7 Completed tasks marked as grey
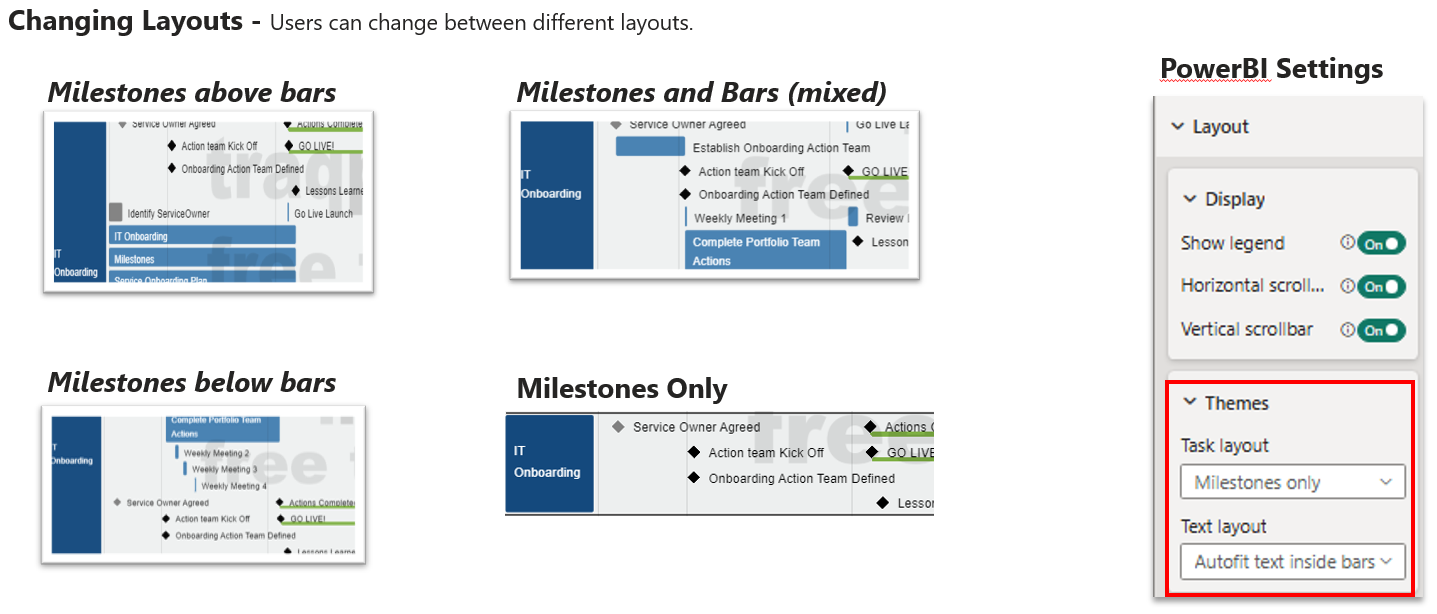
8 Changing Layout Options
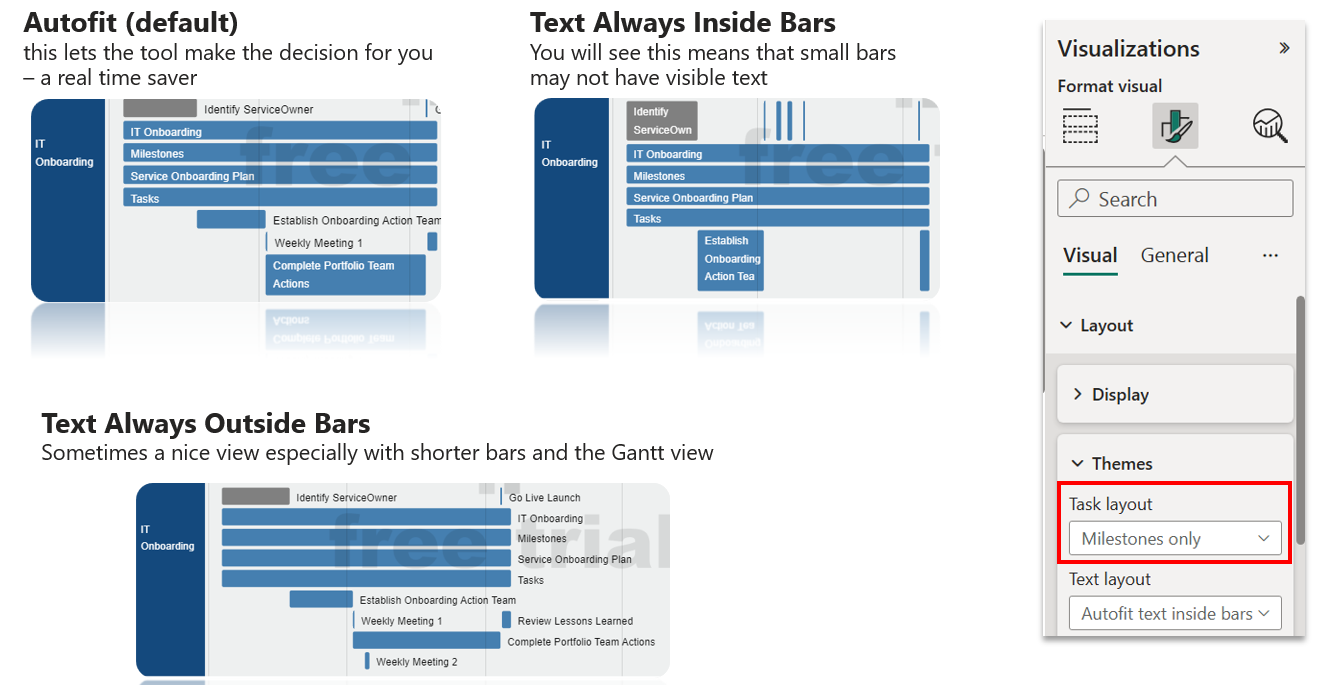
9 Text Layout Options
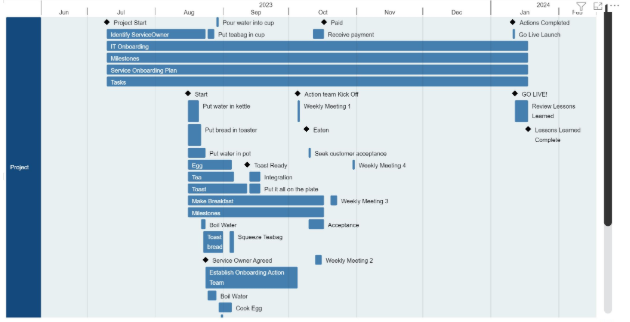
10 Showing Milestones Only
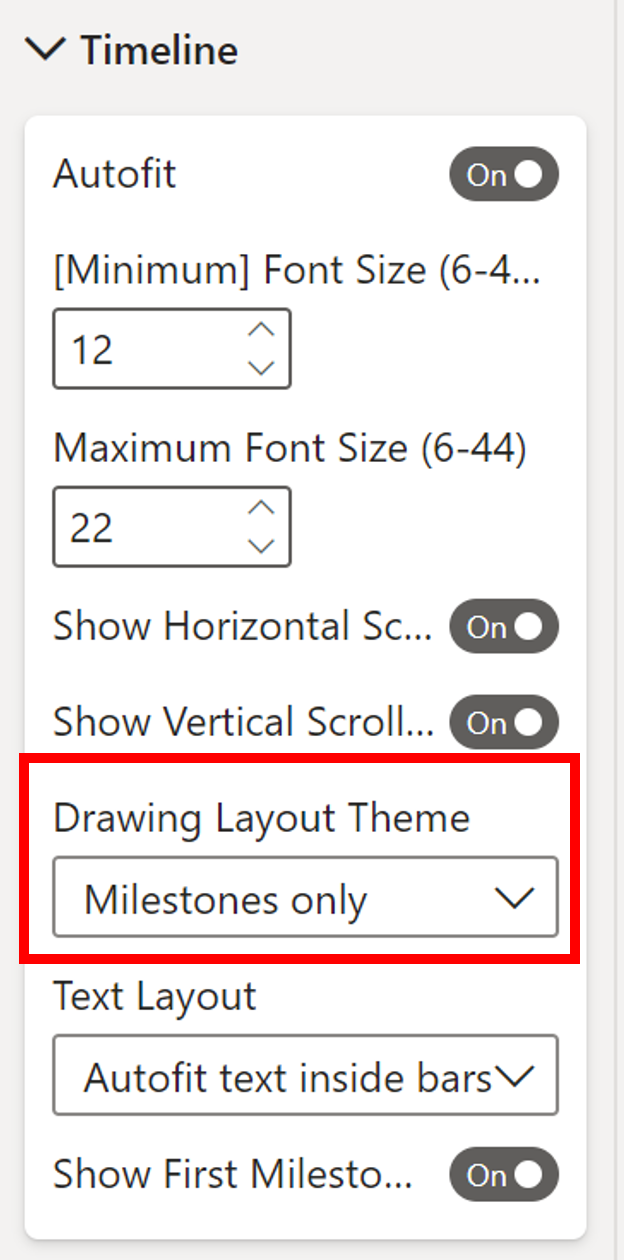
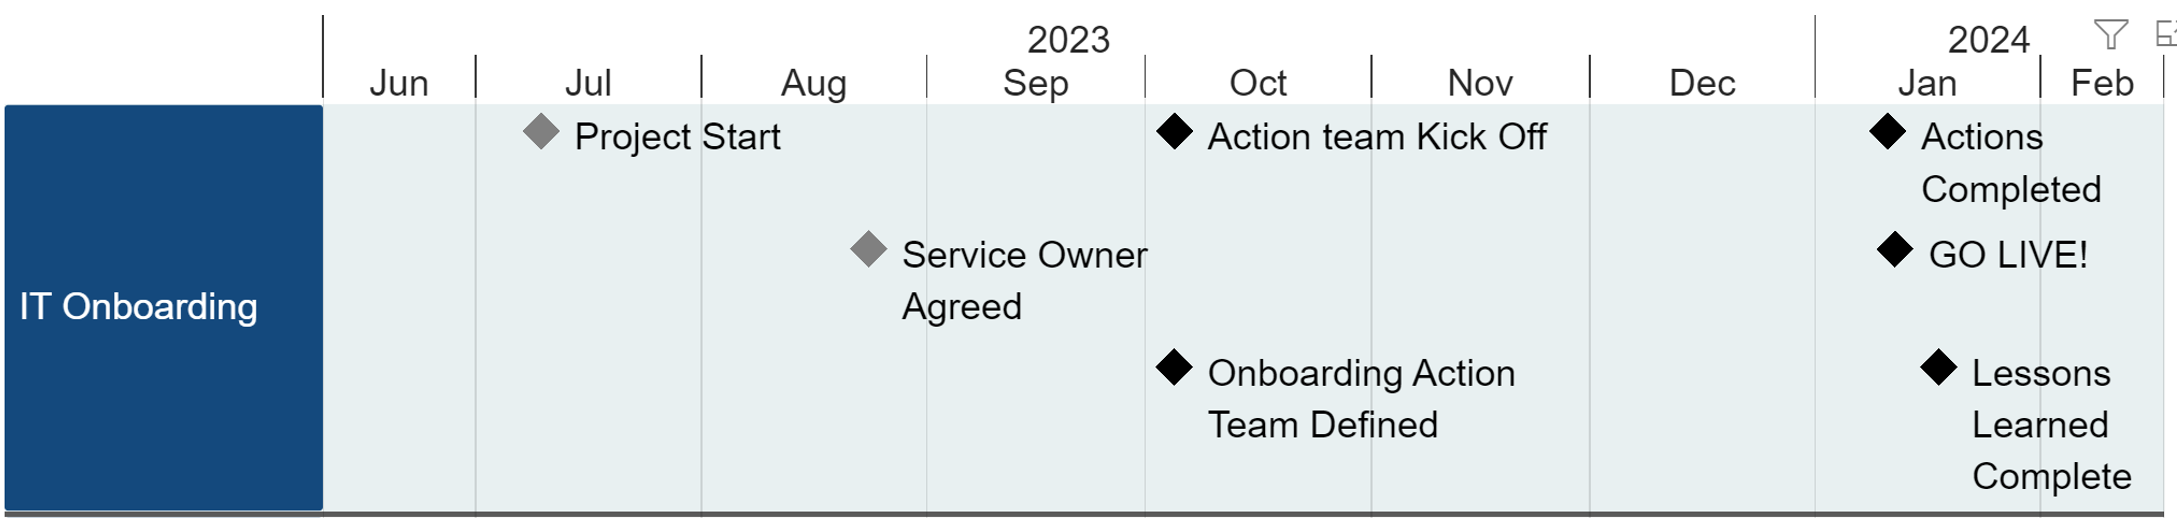
Setting the milestones only will remove all bars leaving only milestones as shown in the picture above
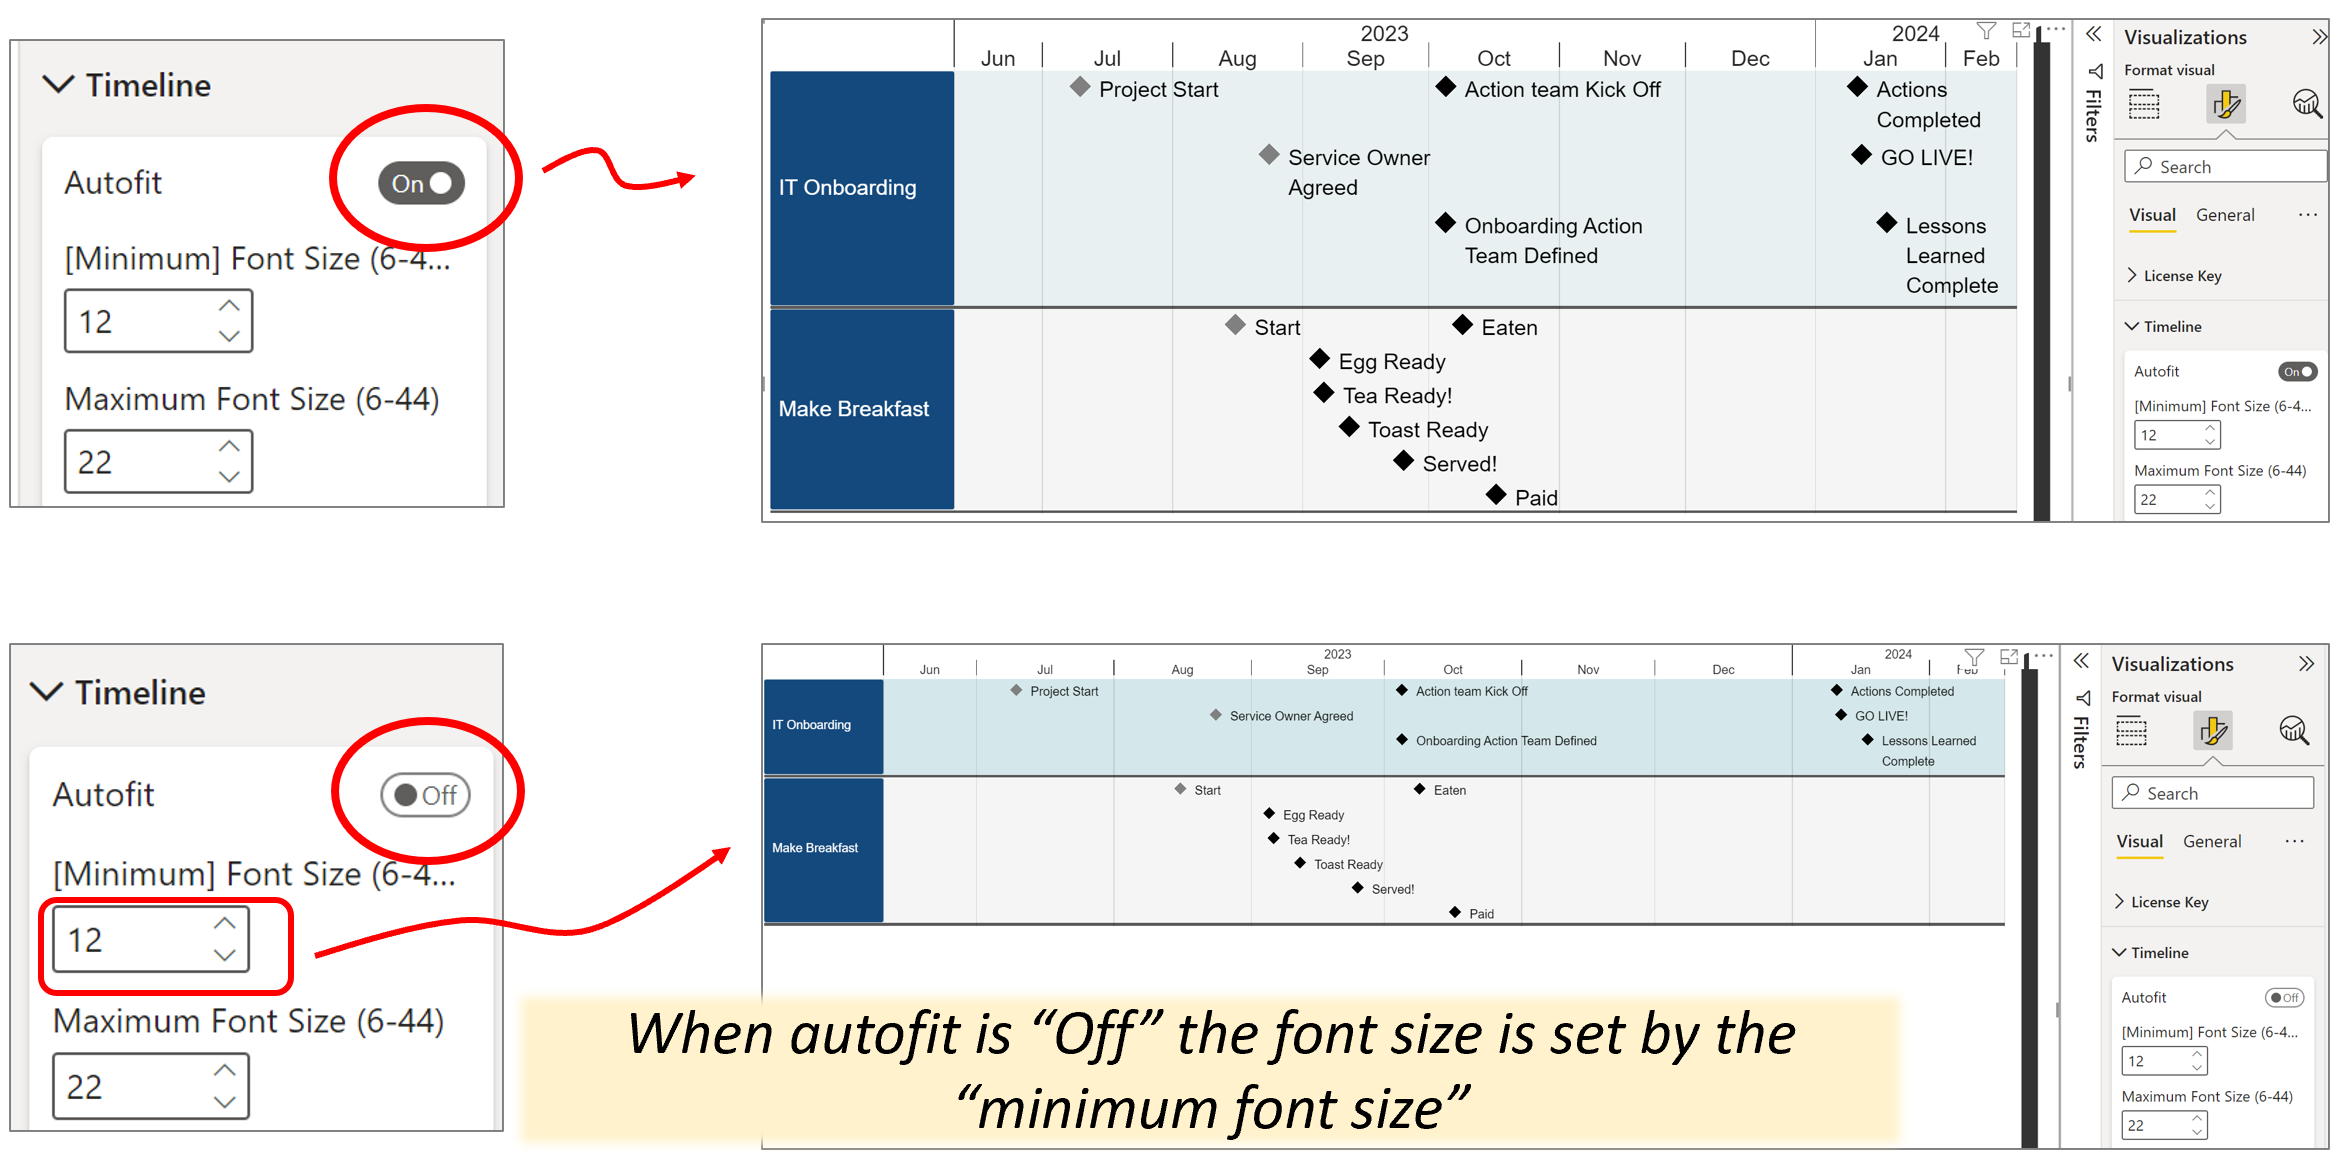
11 Autofit and Zoom
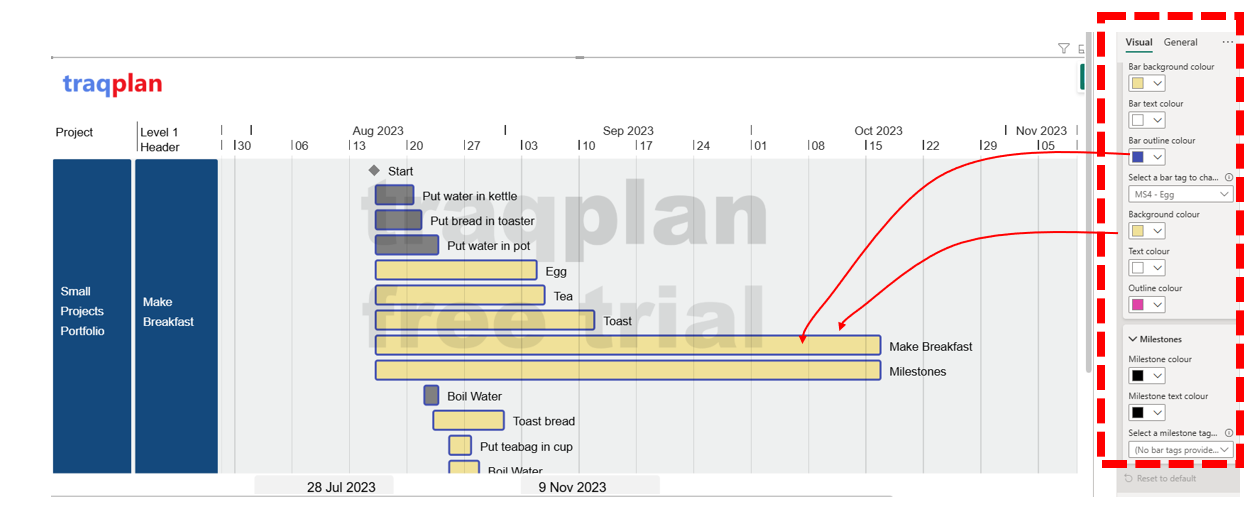
12 Customise Colors and Shapes